The meta-study reveals that the results of the 29 studies are in fact more similar than what the authors themselves have recognized. The similarities between the findings of the different studies have been obscured by the common practice of factor rotation. The concept of factor rotation can be illustrated with the famous Inglehart-Welzel cultural map as example:
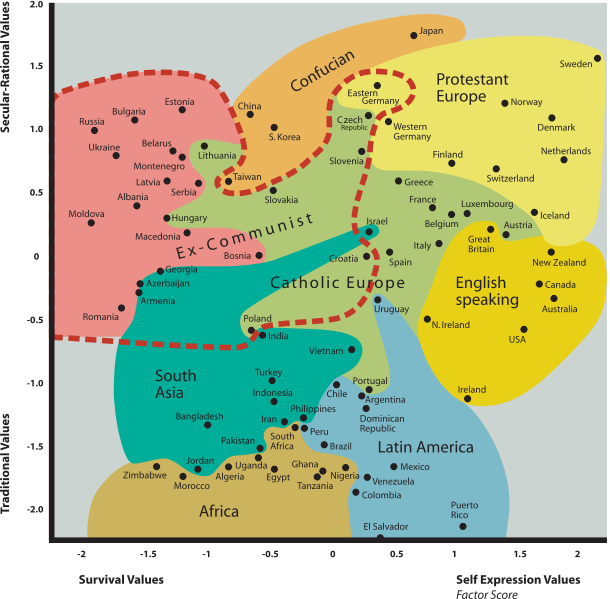
This map is the result of a factor analysis which seeks to reduce a larger number of variables to a few factors that can explain most of the variance. This map may be rotated arbitrarily, and several different rotation methods are commonly used. The same results could have been represented differently by rotating the map differently or by placing the two axes differently. Many different studies of cultural differences have published factor analysis results with different numbers of factors and different rotations of the axes. The authors of the different studies have tried to interpret the rotated factors that came out of their statistical software, and invented new confusing names for each new factor that they discovered, without realizing that their results would be easier to interpret and more similar to previous studies if the factors had not been rotated.
The meta-study finds that there is one super-factor that accounts for a large part of the cultural differences in almost all of the studies. This super-factor combines many different effects relating to economic development, technology, and institutions, as well as a number of socio-psychological phenomena. These different effects happen to be so strongly correlated with each other - for a number of reasons - that they form a single general factor, which we may interpret as general development or modernization. A second factor accounts for some east-west differences, and in particular the distinctive cultural values of East Asian cultures. The common factors that come out of the meta-study are illustrated in the following map, without rotation:
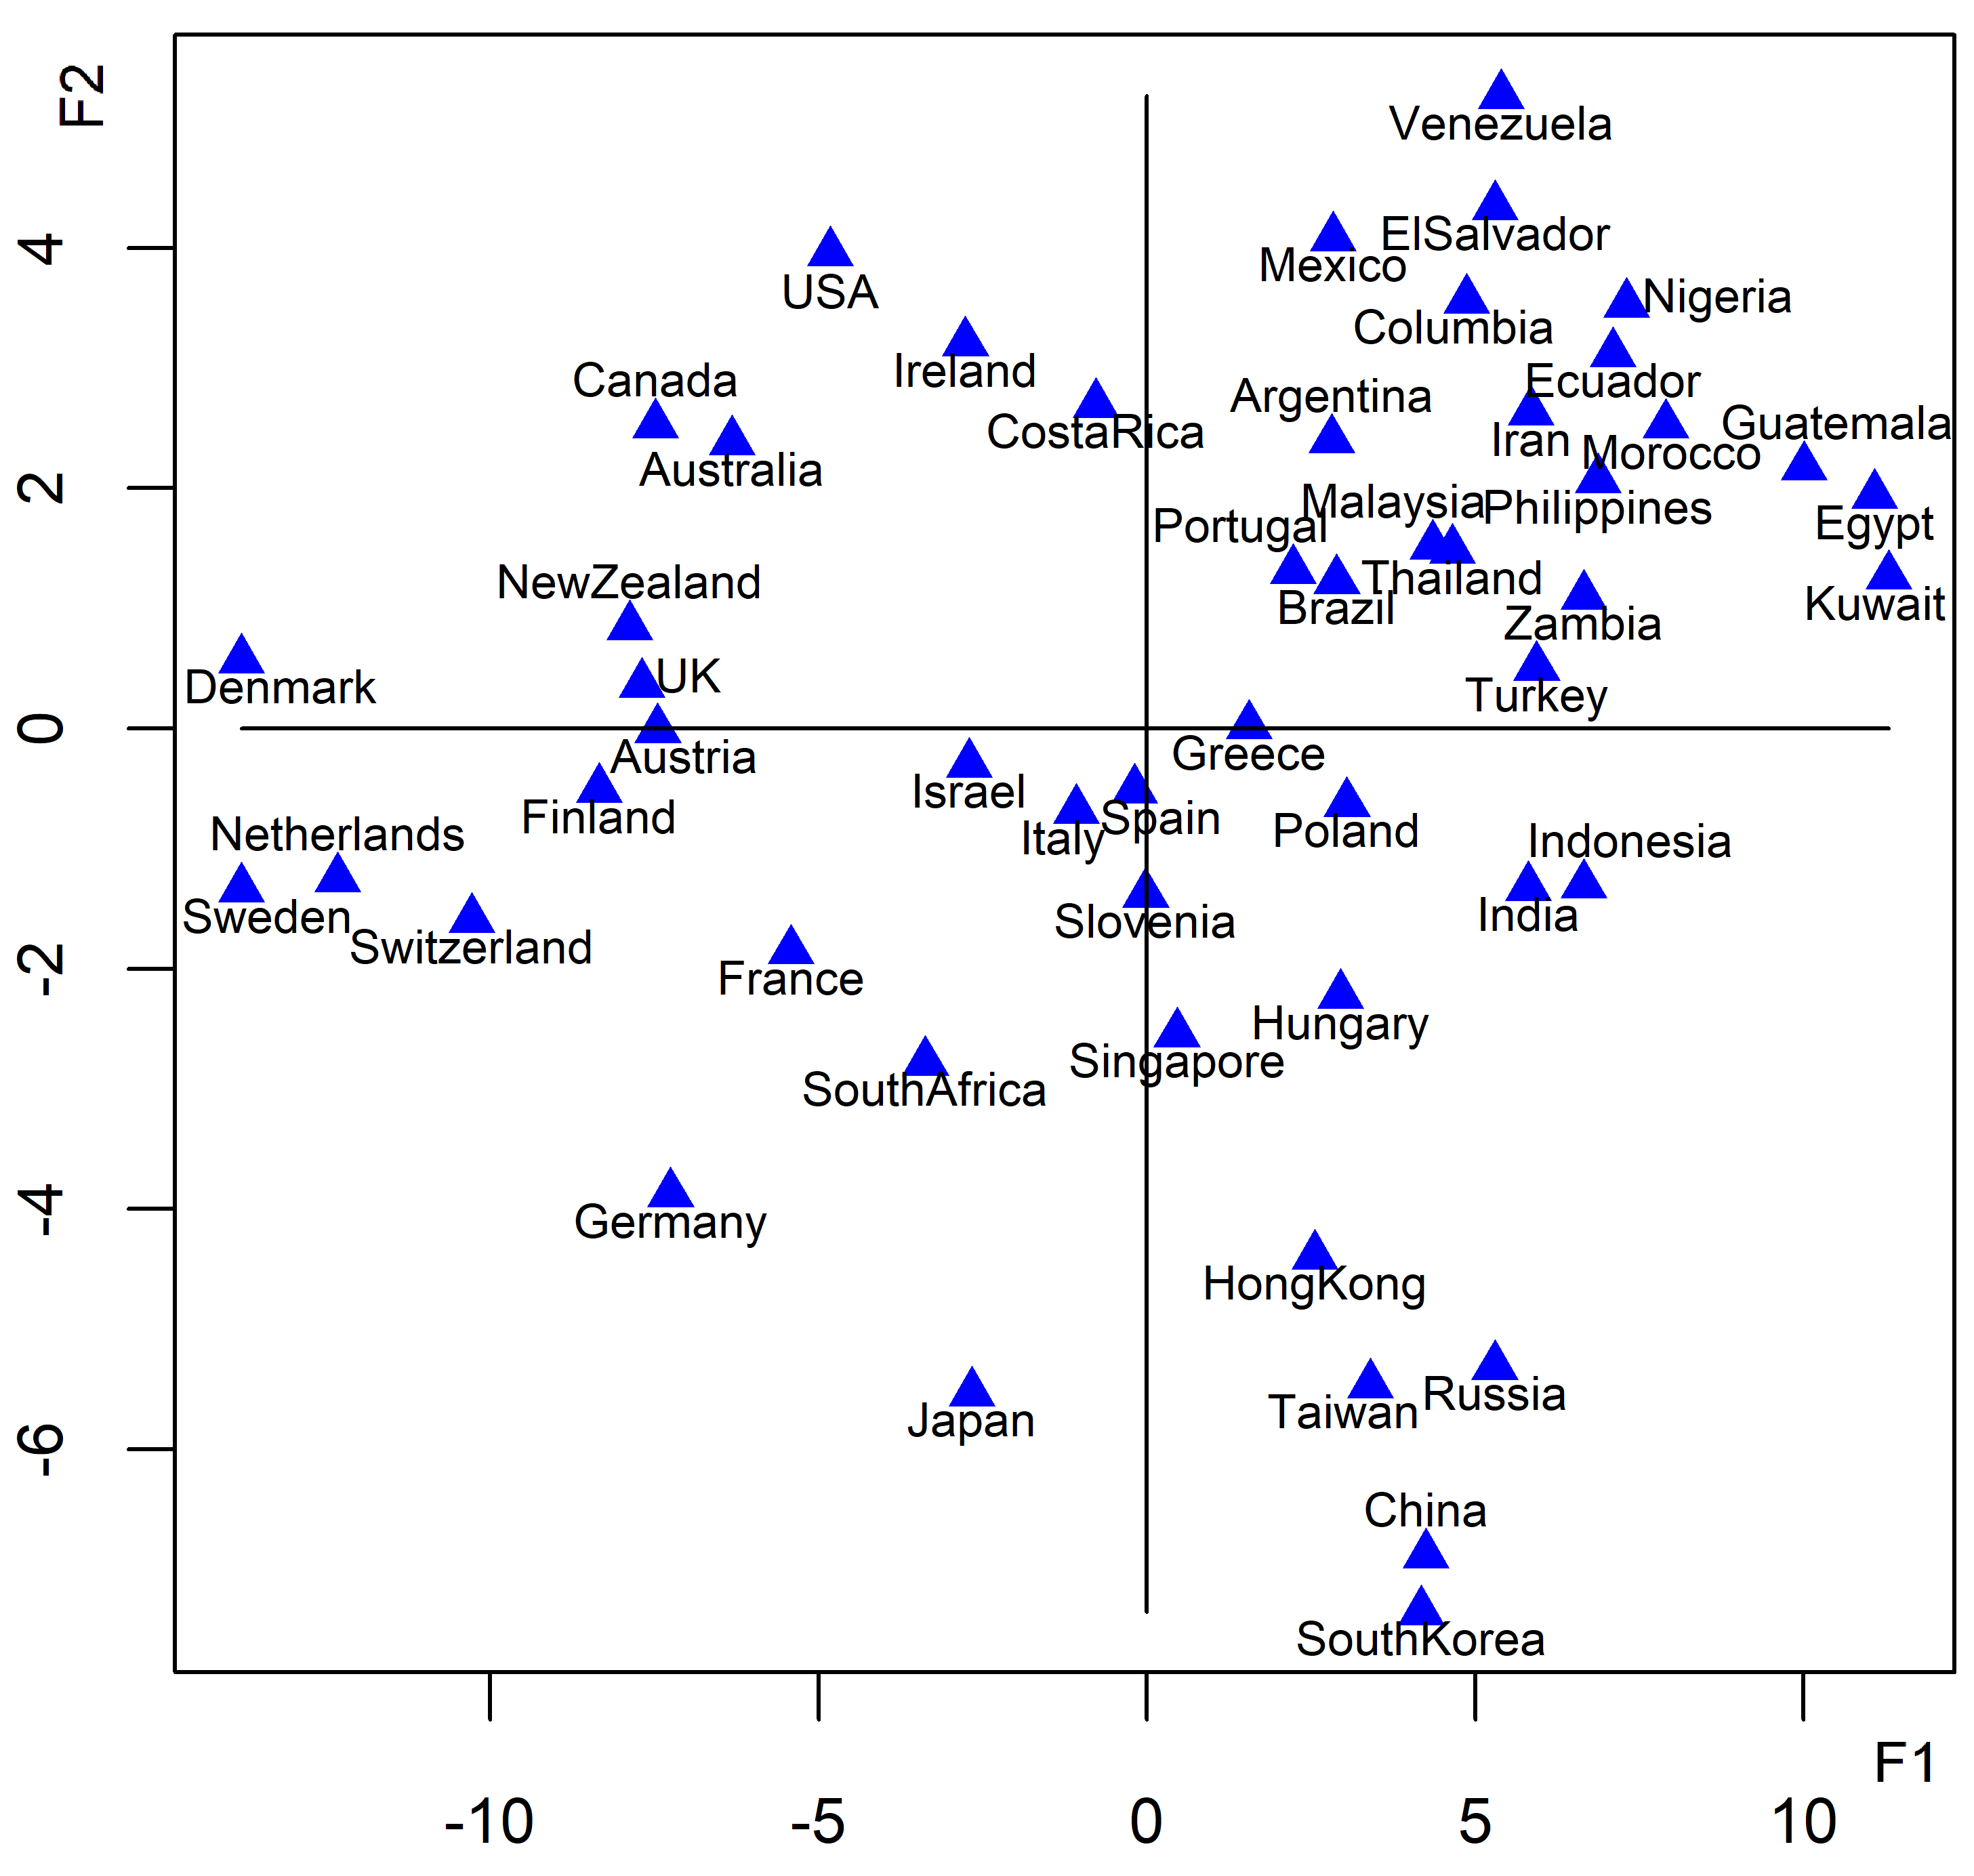
The X-axis on this map corresponds to a diagonal line from the upper right to the lower left corner of the Inglehart-Welzel map. Highly developed, rich, and peaceful countries are found to the left on the second map, while less developed and more conflict-filled countries are found on the right. The Y-axis on the second map corresponds to an approximately vertical line from top to bottom on the Inglehart-Welzel map.
The finding of these two general factors turns out to be highly reproducible among the different cross-cultural studies, based on different methods and concepts and different data sources, such as the big World Values Survey, the Survey of World Views, the GLOBE study, and many others.
The existence of the super-factor was actually predicted from regality theory. The second general factor (East Asian factor) was not predicted in advance by any theory. The logic behind the prediction of the super-factor can be explained as follows. It is no big surprise that economic development, technology, and institutions are mutually supporting sectors that tend to be strongly correlated. Regality theory adds psychological reactions to our collection of theoretical explanations. Economic, technological, and institutional development are all contributing to improved existential security, including better health, protection from violence, and protection from destitution. Improved collective security has a variety of social psychological effects, including support for peace and democracy, tolerance, secularization, and liberalization, according to regality theory. This leads to the prediction that development and modernization will be correlated with a range of social, cultural, and psychological variables, such as e.g. individualism, secular values, self-expression values, emancipative values, gender egalitarianism, and sociosexuality; and negatively correlated with power distance, religiosity, cynicism, and tightness. These are all cultural variables that are often included, in one form or another, in studies of cultural differences. The prediction was that regality is low in rich and highly developed societies. This is confirmed by the second map, where we find the rich welfare states of Northern Europe at the extreme left (high security and low regality), while less developed and conflict-ridden countries are found at the right end of the map (high regality).
The existence of the super-factor does not mean that culture always evolves in the same direction. The idea of linear cultural evolution was rejected long ago. The super-factor reflects the fact that different sectors have been following parallel trajectories in the past. There is no guarantee that they will continue to do so. In fact, we have seen a backlash in democracy in many countries in recent years despite economic progress. This shows that divergence is indeed possible.
Reference:
Agner Fog: A Test of the Reproducibility of the Clustering of Cultural Variables. Cross-Cultural Research, 2020.
Open access preprint.